 PLN
PLN BRL
BRL CZK
CZK EUR
EUR EUR
EUR EUR
EUR EUR
EUR GBP
GBP RUB
RUB SEK
SEK USD
USD
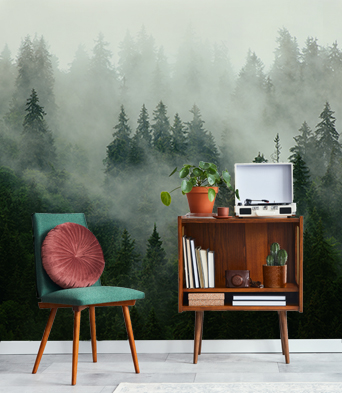


Obraz na plátně
Naše obrazy jsou tištěny na vysoce kvalitním uměleckém plátně CANVAS, které je nataženo na pevné vnitřní rámy z borovice. Boční okraje plátna jsou potištěné. Obraz je připraven k zavěšení na stěnu okamžitě po rozbalení zásilky.
- ✓ Umělecké plátno CANVAS
- ✓ Vysoká kvalita
- ✓ Vnitřní rám z borovice
Gramáž plátna: 300 g/m2
Dostupné možnosti: Obrazy v jednom kuse nebo ve více částech (skládající se ze dvou, tří, čtyř nebo pěti částí)
Způsob čištění: vlhkým hadříkem
Zásilka obsahuje: obraz (potištěné plátno natažené na vnitřní rámy), háčky a hřebíčky

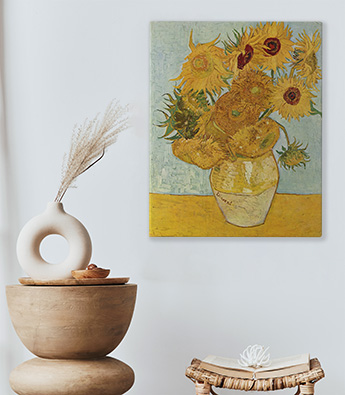
Obraz v rámu
Naše obrazy jsou tištěny na vysoce kvalitním uměleckém plátně CANVAS, které je nataženo na pevné vnitřní rámy z borovice. V této verzi je obraz navíc klasicky zarámován - používáme dřevěný vnější rám. Na výběr máte dvě barvy (černou nebo hnědou). Vnější rámy jsou dostupné v konkrétních rozměrech. Obraz je připraven k zavěšení na stěnu okamžitě po rozbalení zásilky.
- ✓ Umělecké plátno CANVAS
- ✓ Potištěné boční okraje plátna
- ✓ Vnitřní rám z borovice
Gramáž plátna: 300 g/m2
Dostupné doplňky: Vnější dřevěné rámy jsou dostupné ve dvou barvách
Způsob čištění: Materiál je možné přetřít vlhkou utěrkou
Zásilka obsahuje: obraz (potištěné plátno natažené na vnitřní rámy), dřevěný vnější rám, háčky a hřebíčky

Dvoudílný obraz na plátně
Naše obrazy jsou tištěny na vysoce kvalitním uměleckém plátně CANVAS, které je nataženo na pevné vnitřní rámy z borovice. Obraz je připraven k zavěšení na stěnu okamžitě po rozbalení zásilky.
- ✓ Dvě části
- ✓ Umělecké plátno CANVAS
- ✓ Potištěné boční okraje plátna
- ✓ Vnitřní rám z borovice
Gramáž plátna: 300 g/m2
Způsob čištění: vlhkým hadříkem
Zásilka obsahuje: obraz (potištěné plátno natažené na vnitřní rámy), háčky a hřebíčky
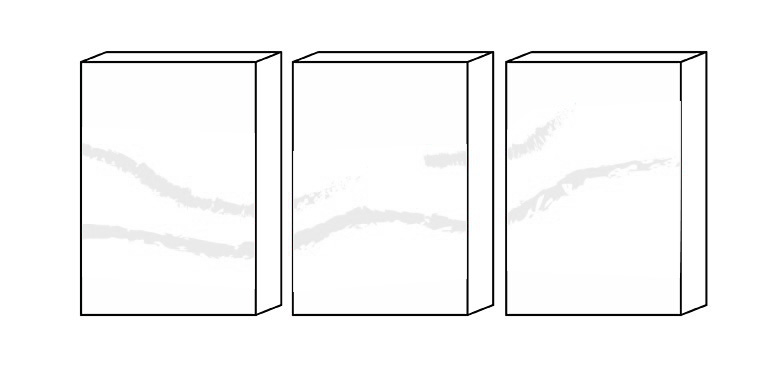
Třídílný obraz na plátně
Naše obrazy jsou tištěny na vysoce kvalitním uměleckém plátně CANVAS, které je nataženo na pevné vnitřní rámy z borovice. Obraz je připraven k zavěšení na stěnu okamžitě po rozbalení zásilky.
- ✓ Tři části
- ✓ Umělecké plátno CANVAS
- ✓ Potištěné boční okraje plátna
- ✓ Vnitřní rám z borovice
Gramáž plátna: 300 g/m2
Způsob čištění: vlhkým hadříkem
Zásilka obsahuje: obraz (potištěné plátno natažené na vnitřní rámy), háčky a hřebíčky

Čtyřdílný obraz na plátně
Naše obrazy jsou tištěny na vysoce kvalitním uměleckém plátně CANVAS, které je nataženo na pevné vnitřní rámy z borovice. Obraz je připraven k zavěšení na stěnu okamžitě po rozbalení zásilky.
- ✓ Čtyři části
- ✓ Umělecké plátno CANVAS
- ✓ Potištěné boční okraje plátna
- ✓ Vnitřní rám z borovice
Gramáž plátna: 300 g/m2
Způsob čištění: vlhkým hadříkem
Zásilka obsahuje: obraz (potištěné plátno natažené na vnitřní rámy), háčky a hřebíčky
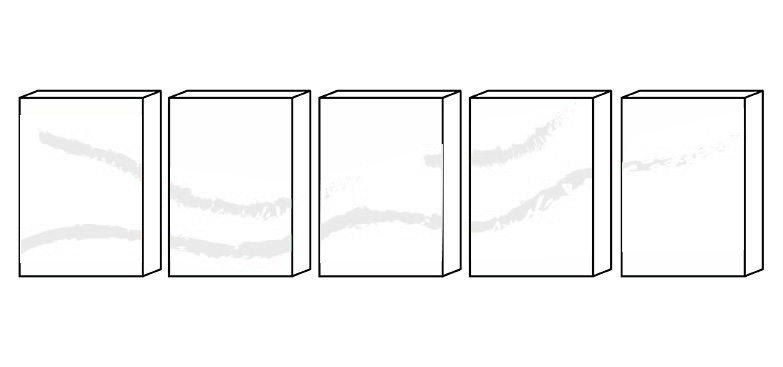
Pětidílný obraz na plátně
Naše obrazy jsou tištěny na vysoce kvalitním uměleckém plátně CANVAS, které je nataženo na pevné vnitřní rámy z borovice. Obraz je připraven k zavěšení na stěnu okamžitě po rozbalení zásilky.
- ✓ Pět částí
- ✓ Umělecké plátno CANVAS
- ✓ Potištěné boční okraje plátna
- ✓ Vnitřní rám z borovice
Gramáž plátna: 300 g/m2
Způsob čištění: vlhkým hadříkem
Zásilka obsahuje: obraz (potištěné plátno natažené na vnitřní rámy), háčky a hřebíčky


